
Hello!
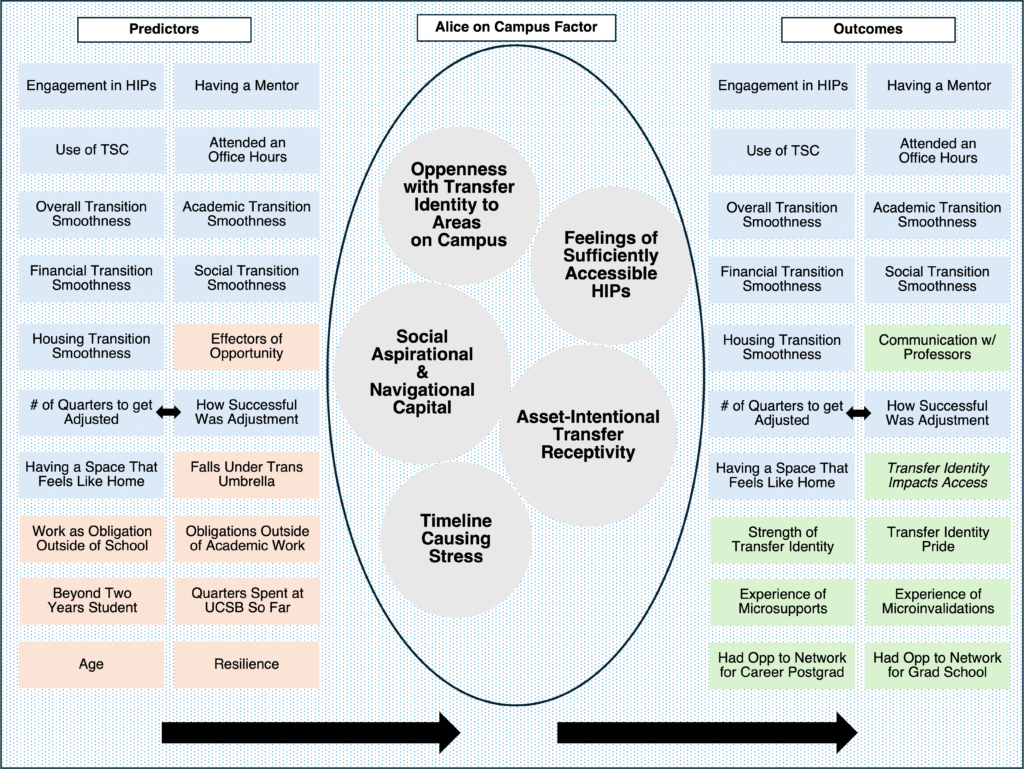
Today I want to show you a visual I made recently that I really like (even though it’s almost assured my real model will not look exactly like this) for my honors thesis. It’s a descriptive system of variables, showing a process; outcome variables go through the car wash that is my constellation of latent variables (mediators), and affects the outcome in some way.
I had to make this because I need this paper physically printed out in front of me, to stare at, to write on, to scribble out and rewrite; it is almost impossible for me to do this high cognitive ability demanding tasks like creatively navigating data analysis, but having physical references scoops me out of the ocean and into a threshold of safety and security. Granted, that sense of safety is totally popped and deflated within a few minutes, always, as I rush to plot the changes in my model to the coding software where I run the analyses, and find myself nearly back at step one.
A model fails to converge; the fit indices look troubling; there are Heywood cases. Two months ago I would have panicked and fizzled out at the sight of the sheer unanswered and still in progress things that I have going on (I mean, not just with the Honors Thesis, I have other research too…), but now for me I’ve made much greater peace with being able to wake up to it each morning and go to bed with it unfinished each night.
This project is teaching me something beyond patience; it really is a marathon and not a sprint. The results and the synthesis and the convergence of theories and models is happening, it’s just going at the pace that it knew that it would take that I did not know. I did not think I would be spending actual months staring at code and puzzling out to better interpret several dozen small survey questions.
Well anyway, I hope you enjoy:
Leave a Reply